The MyAiTrend (MAT) Methodology
How Does it Work?

The MAT Methodology blends technical analysis, a proprietary method and Artificial Intelligence with predictive analysis that identifies each stocks growth and performance stages.
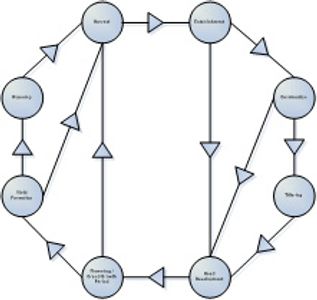
Harvesting Metaphors MyAiTrend Development Stages

There are so many different charting techniques, methodologies and theories available today. One method is not necessarily better than the other and each method provide its own unique interpretation, with its own benefits and drawbacks. When all is said and done, most people and outlets utilize the same charting techniques, methodologies and theories that they feel will easiest to understand. It is the analysis of the price action that separates them apart. With that in mind, a new and unique methodology was created, the MyAiTrend (MAT) Methodology . The MAT Methodology is based on growth stages and historical studies which encapsulate market characteristics, trend movements and the use of Artificial Intelligence for predictive analysis with a unique way of looking at stocks that is unavailable anywhere else in the industry. Using a rigorous analytics process, MyAiTrend creates an easy to read graph composed of the stock’s current and future development stages with technical indicators, highlighting optimal entry and exit points, allowing the user to capture the most alpha in every stock.

Breaking Down MyAiTrend (MAT) Methodology
The MyAiTrend Methodology (MAT) is calculated using the following formula: Y=a+bX
Where x is the date, y is the stock price, n is the number of days, a is the intercept value, b is the trend classification value, Y is the predicted stock price, and X is the predicted date.
Calculating the maximum error prediction value:
L∞(E)=max e→E|Oe-Pe|2
The minimum error prediction is calculated as: L∞(E)=max e→E|Oe-Pe|2 Where Oe is the Oe value of the stock price observation, Pe is the Pe value of the stock price prediction, L∞(E) is the error prediction value, max is the maximum, and min is the minimum.
Copyright © 2023 MyAiTrend Limited - All Rights Reserved.
By using this website, you understand the information being presented is provided for informational purposes only and agree to our Terms of Use and Privacy Policy.
MyAiTrend Limited is not operated by a broker, a dealer, or a registered investment adviser. Under no circumstances does any information posted on MyAiTrend.com represent a recommendation to buy or sell a security. The information on this site, and in its related application software, spreadsheets, blog, email and newsletters, is not intended to be, nor does it constitute, investment advice or recommendations. In no event shall MyAiTrend.com be liable to any member, guest or third party for any damages of any kind arising out of the use of any product, content or other material published or available on MyAiTrend.com, or relating to the use of, or inability to use, MyAiTrend.com or any content, including, without limitation, any investment losses, lost profits, lost opportunity, special, incidental, indirect, consequential or punitive damages. Past performance is a poor indicator of future performance. The information on this site, and in its related blog, email and newsletters, is not intended to be, nor does it constitute, investment advice or recommendations. The information on this site is in no way guaranteed for completeness, accuracy or in any other way. Market data by IEX. For more information, see our disclosures.
This website uses cookies.
We use cookies to analyze website traffic and optimize your website experience. By accepting our use of cookies, your data will be aggregated with all other user data.